Lab Team
The phase 2 data describes population means over 48 weeks, not an individual timeline. Here is what the published curve shows and why it cannot be read personally.
The published evidence describes what happened to a group of people over 48 weeks under a fixed protocol. It does not describe what will happen to any individual, and the difference between those two things is the entire answer to this question. A mean curve is a summary of a population, not a schedule, and reading it as a personal timeline misreads what the number is.
What did the trial actually measure over time?
Everything on this page traces to one source: the 48-week phase 2 obesity trial reported by Jastreboff and colleagues in 2023. Recruitment was United States only, and the enrolled group numbered in the low hundreds. Who those participants were, and what their composition licenses you to conclude, is set out in how the phase 2 cohort was composed. What matters here is narrower: the shape of the data across time.
Two features of the design matter for any timeline question. First, the protocol escalated amounts in steps over time rather than beginning at the target level, so early data points reflect lower exposure than later ones by design. Second, participants received structured lifestyle intervention throughout. The curve therefore describes a protocol, not a compound in isolation.
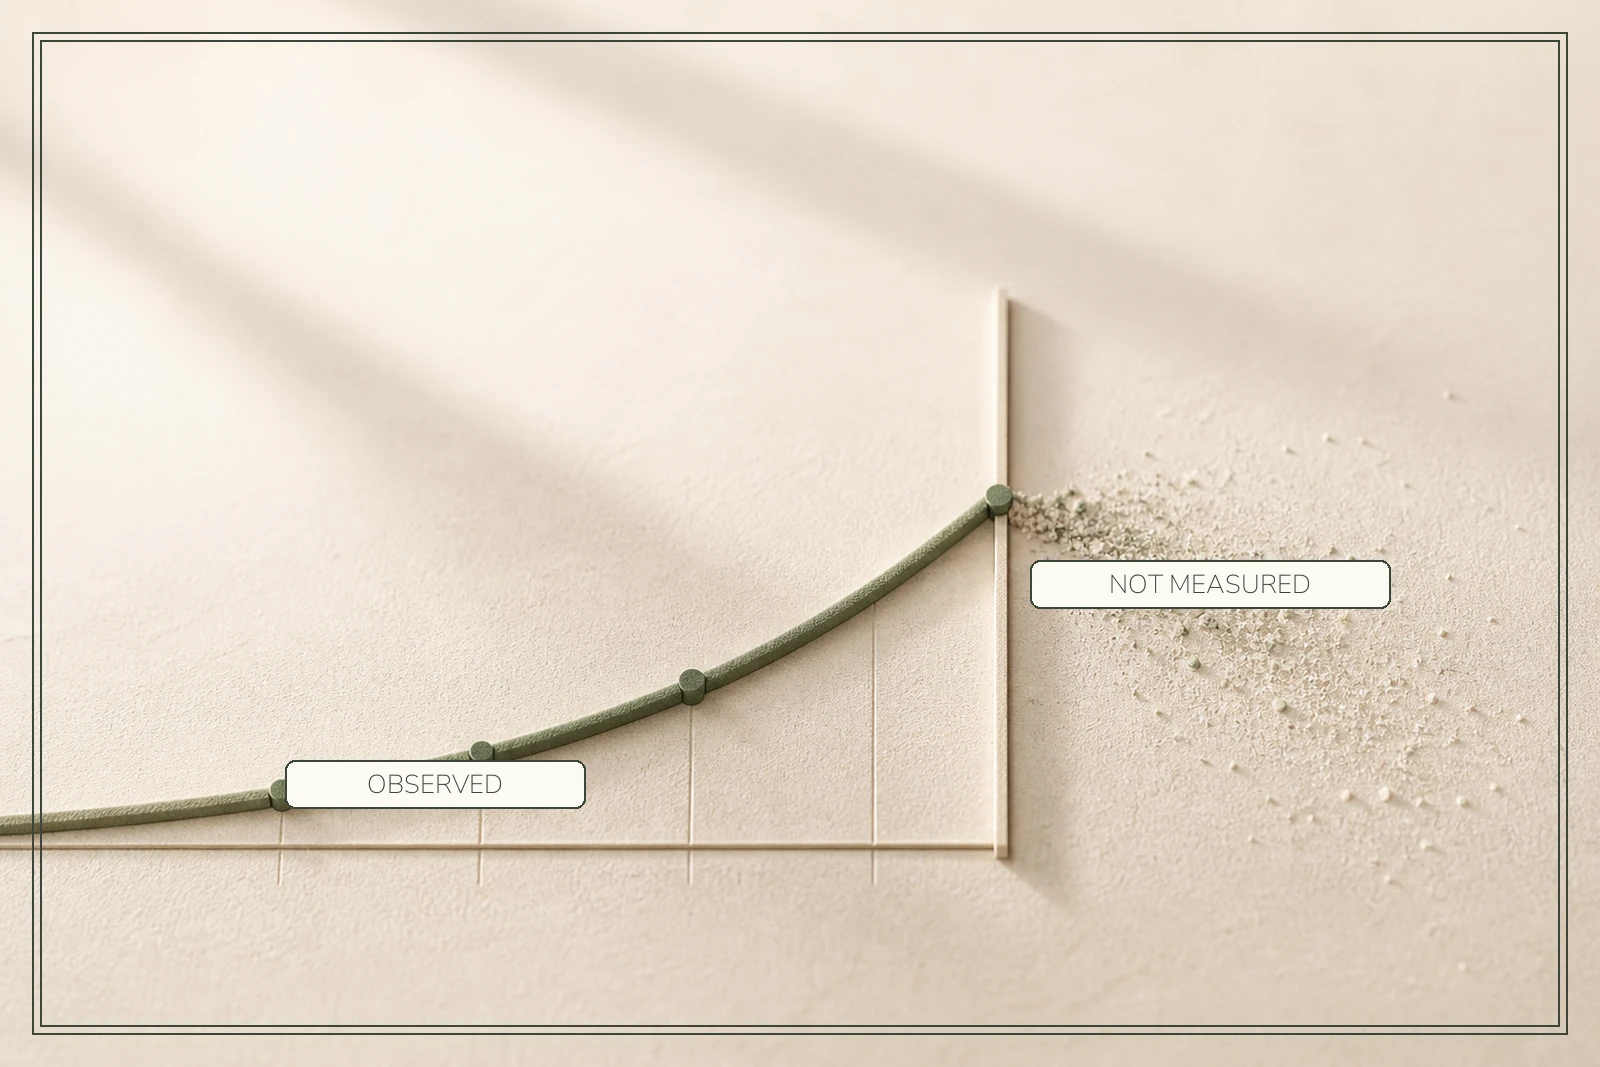
Change was measurable well before the endpoint, and the trajectory continued through the study period. The commonly quoted headline figure is the value at 48 weeks, not the point at which change began.

Had the effect levelled off by the end of the study?
Not clearly, and that is itself a reported finding rather than an absence of one.
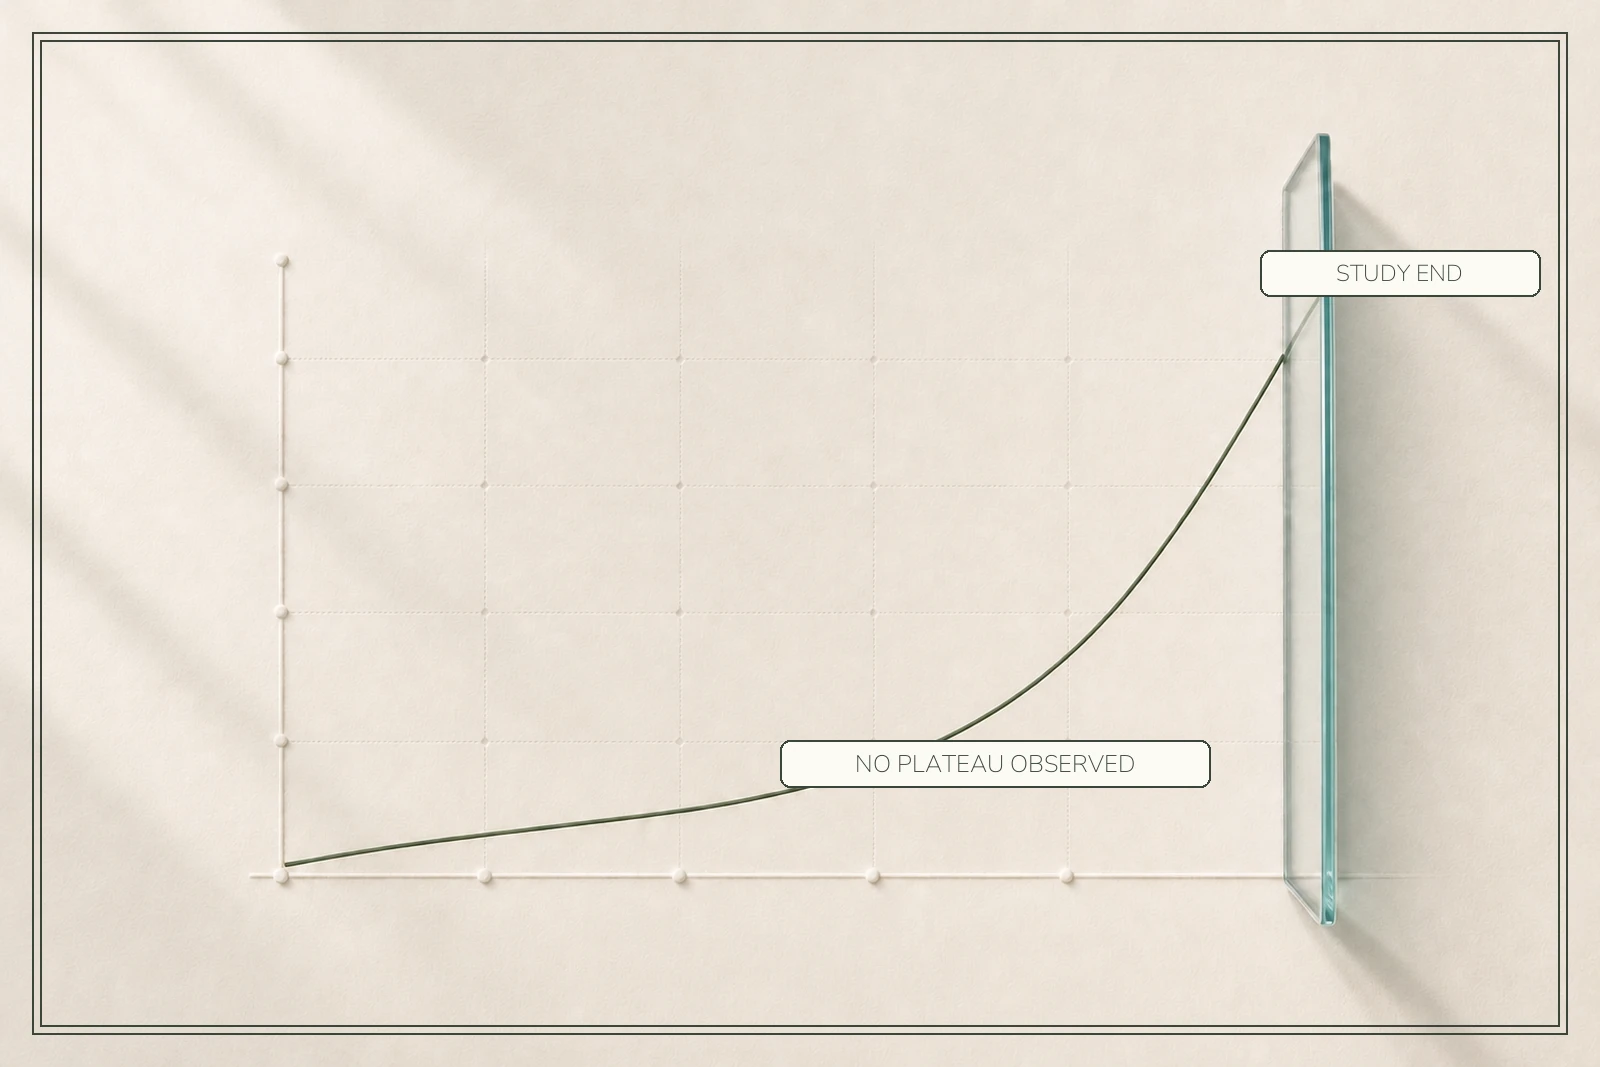
The trajectory had not obviously reached a plateau when the 48-week study concluded. That observation is genuinely interesting, because it means the study ended before the question of where the curve settles could be answered. What happens between 48 weeks and any later point is not described by this trial, and cannot be inferred by extending the line on the page.
This is a common misreading of trial graphs. A curve that is still moving at the edge of the data invites extrapolation, and extrapolation beyond the observation window is not evidence. It is a guess with a chart behind it.
The visual design of trial figures makes the error easy to fall into. A line drawn to the edge of an axis looks like it wants to continue, and the eye finishes the movement whether or not the reader intends it to. Nothing in the plot marks the boundary as a hard stop rather than a convenient cropping, which is why the most important property of a curve like this — where the data ends — is the property least likely to survive being summarised.
What happened after the trial period ended?
The published report does not say, because the study ended there. That is a boundary in the evidence rather than a reassuring silence, and it hides two different questions that are worth separating.
The first is a duration question: what happens with continued exposure beyond 48 weeks. Since the trajectory had not clearly settled when the study closed, this is genuinely open — the curve stopped being observed before it stopped moving, and where it would have gone is not recoverable from the published data.
The second is a durability question: what happens when exposure stops. This one has no retatrutide answer at all in the published record. It does have a wider context, and it is worth stating carefully rather than borrowing. Published follow-up work on other compounds in this class has reported regain after discontinuation. That is an observation about those compounds, made in those studies, and presenting it as a retatrutide finding would be precisely the cross-trial error this site keeps warning against. It is offered here as the reason the question is worth asking, not as its answer.
For retatrutide specifically, both questions sit with the phase 3 programme, which is still running. Anyone answering either of them today is describing an expectation rather than reading a result.

Why can an individual timeline not be predicted?
Because the published data does not contain the information that prediction would require.
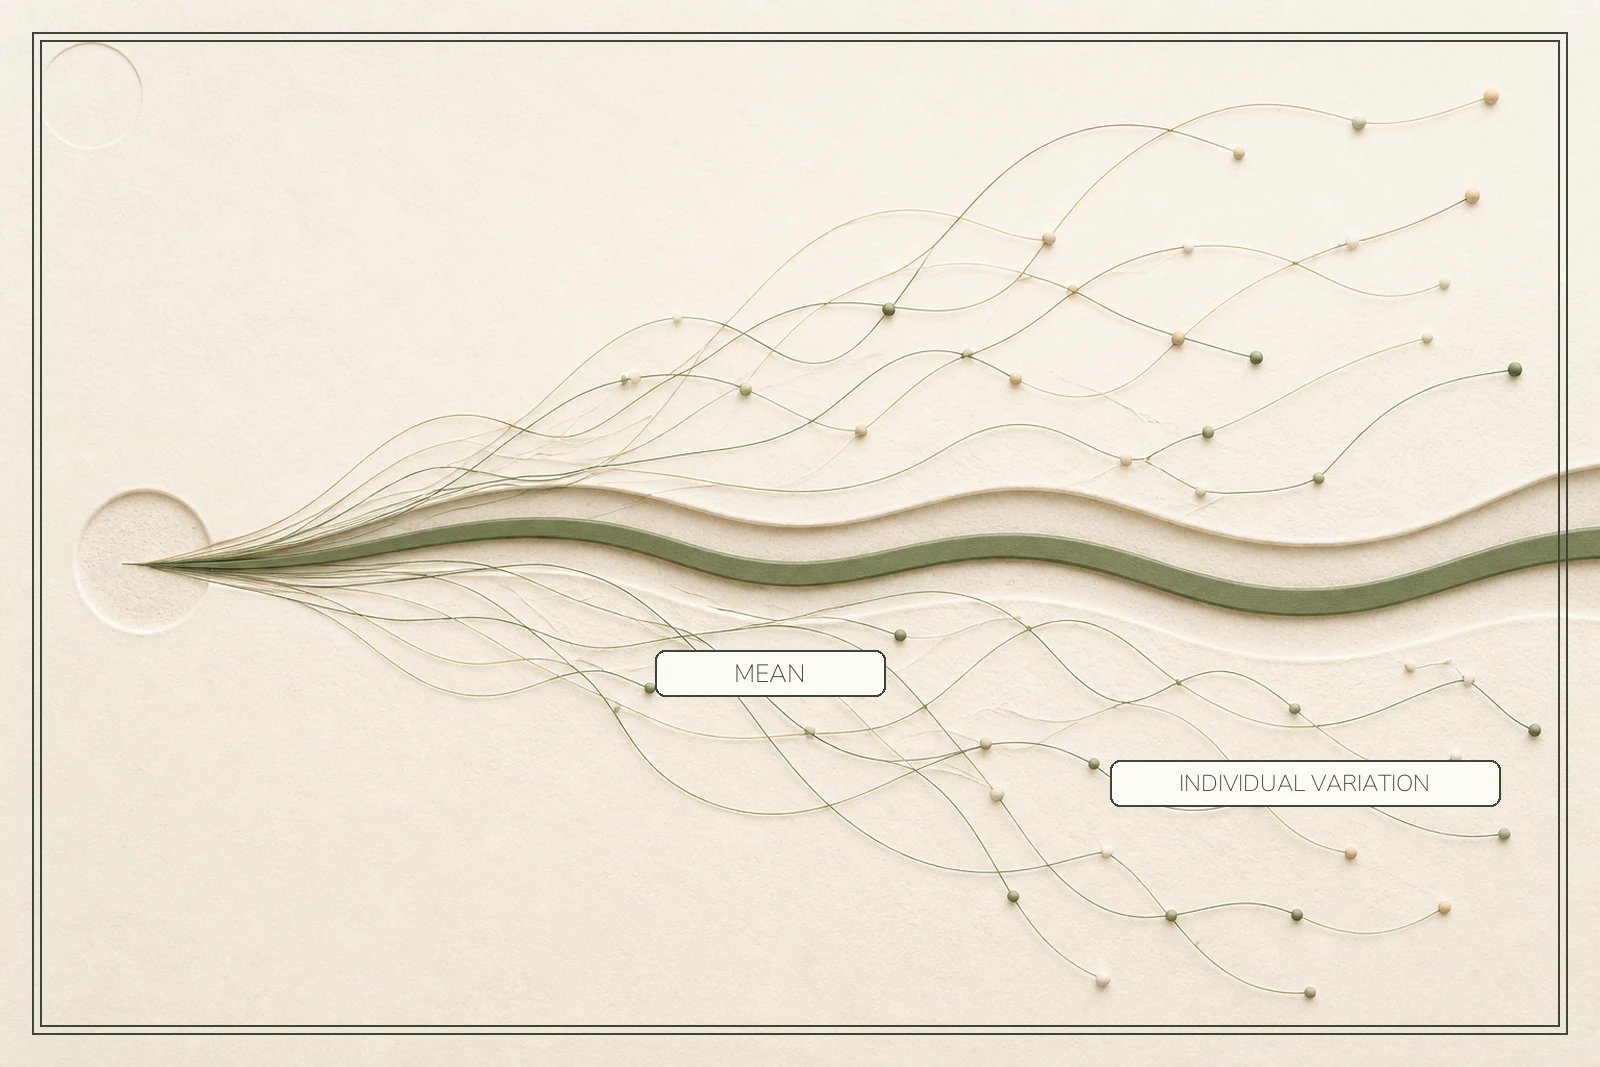
A trial reports central tendency and variation around it. Behind any mean sits a distribution: some participants above it, some below, and in most trials of this kind a meaningful spread between them. The mean is not the typical experience so much as the arithmetic centre of many different ones.
No published data supports predicting where a particular individual falls within that distribution, or how quickly they move through it. Anyone offering a specific personal timeline is not reading it from the literature, because the literature does not contain it. That is a limitation of the evidence rather than a gap we can help fill.
There is a structural reason this gets worse rather than better as a study runs. Individual trajectories in longitudinal data diverge over time — participants start from a common baseline and separate from there — so the distribution around a mean is at its narrowest when the study opens and its widest by the time it closes. The moment at which a mean figure is most often quoted is therefore the moment at which it stands in for any individual least well.
What can you actually influence about the timeline?
The variables that are actually within reach.
Trial timelines are fixed by protocol and cannot be influenced. Material integrity can. Whether a peptide arrived intact, whether it was reconstituted without denaturation, whether it has been stored correctly since and how many freeze-thaw cycles it has been through are all determinable, and all of them affect what is actually present in the vial.
Degraded material does not produce a slower result. It produces an unreliable one, and no timeline reasoning survives contact with material whose contents are uncertain.
The asymmetry is worth naming because it changes where attention is best spent. Trial variables are fixed and published; no amount of care changes them, and no amount of reading extracts more from them than they contain. Material variables are the opposite — they are entirely determined by decisions made before and after the vial arrives, and they are the only part of the picture that responds to being taken seriously.

Why can two lots behave differently?
Because a lot is a manufacturing event rather than an abstraction, and small differences between events end up inside the vial.
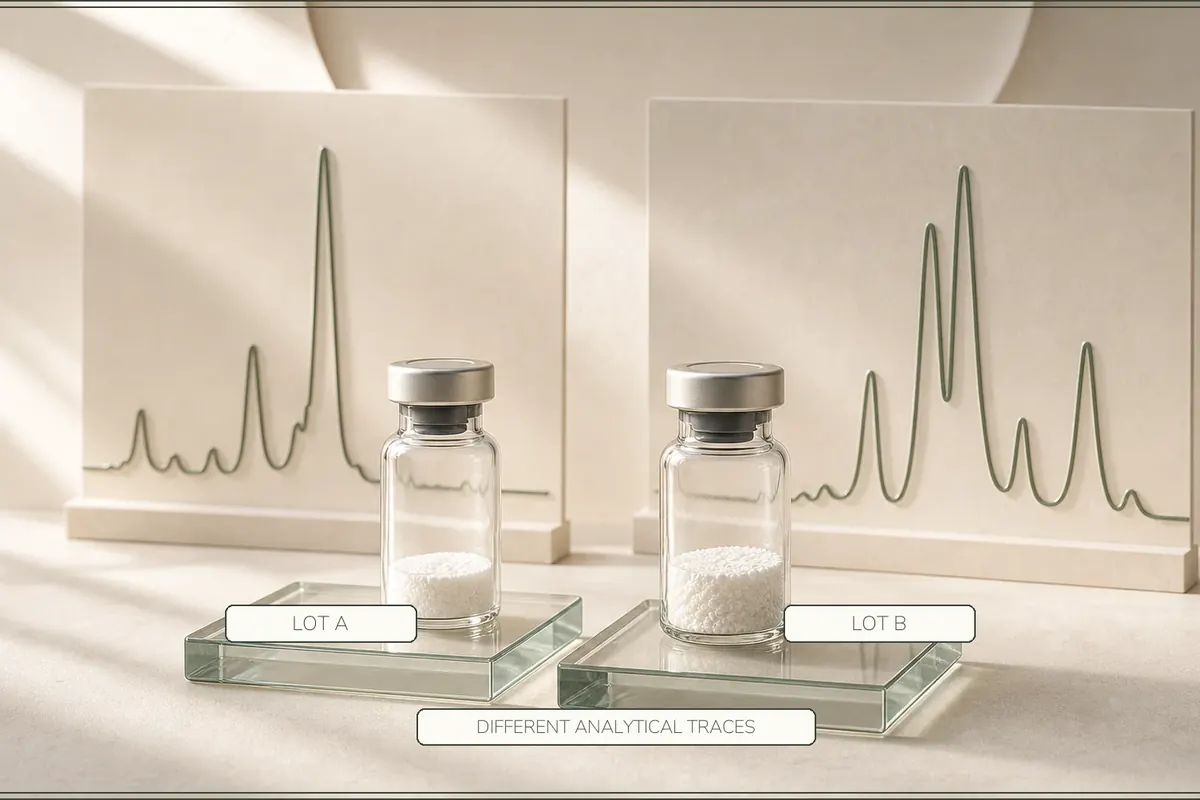
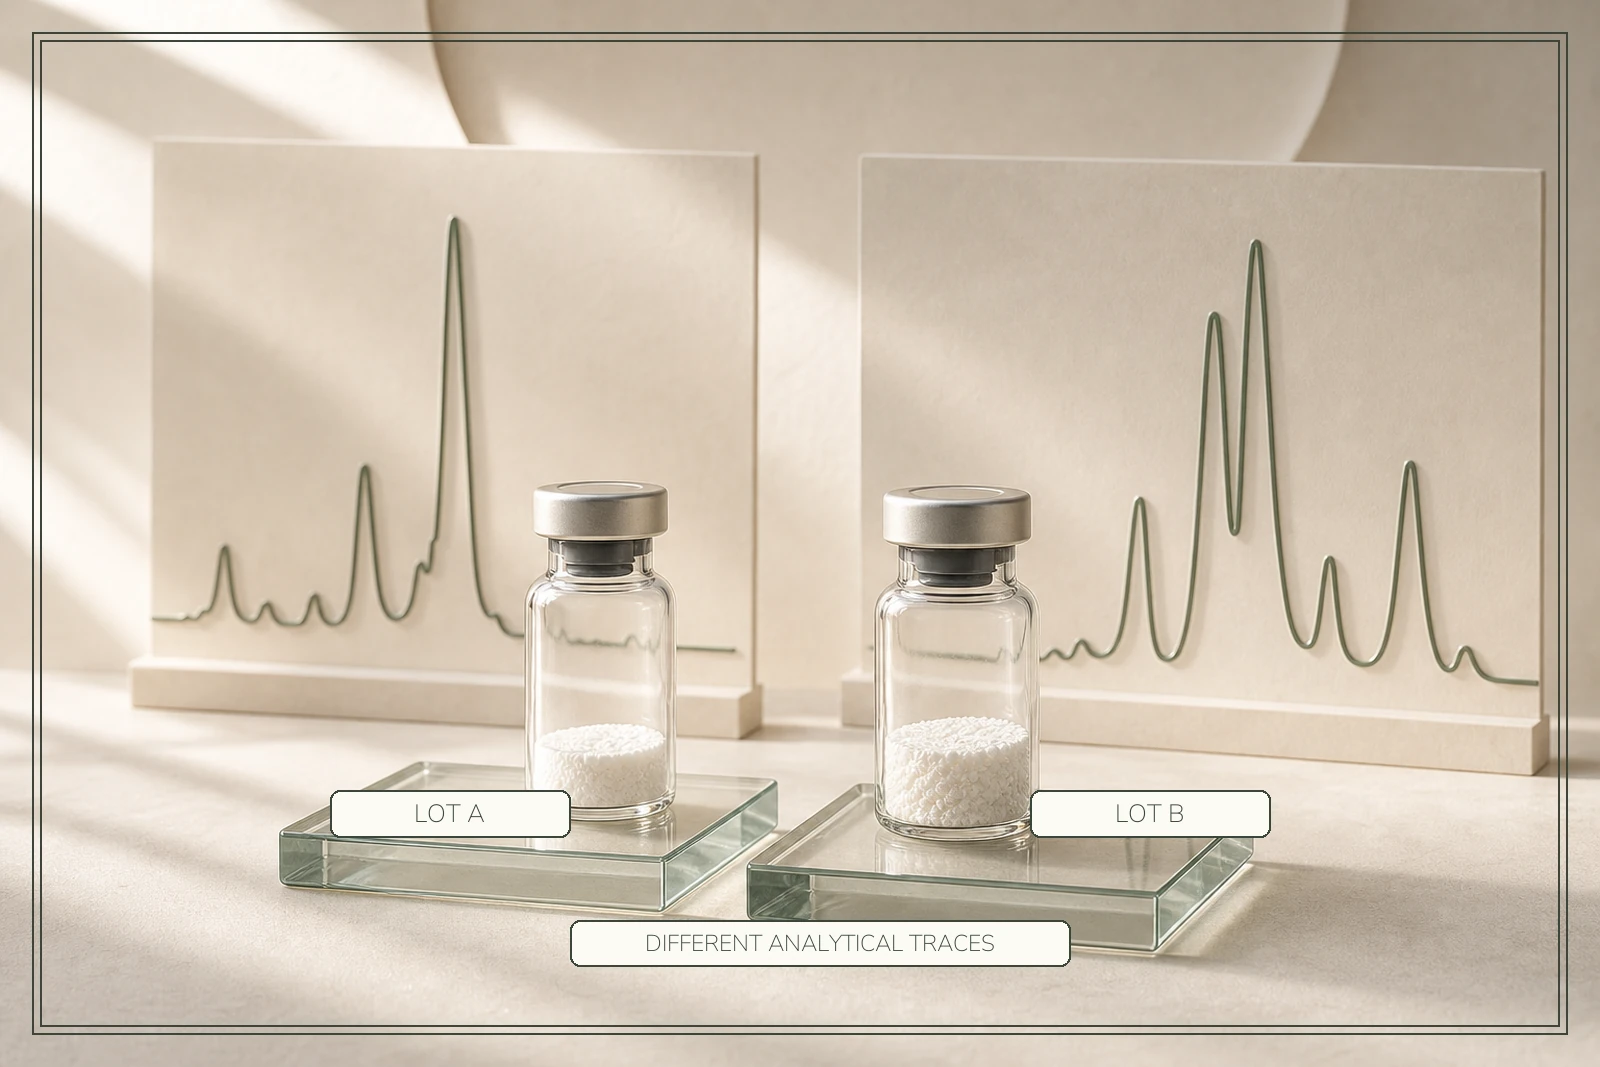
Three things vary. Synthesis and purification are processes with tolerances, so the purity figure and the impurity profile differ from run to run even under a stable method. Lyophilisation quality varies, which shows up as a cake that dissolves readily or one that resists, and as a difference in how stable the dry material is before anyone opens it. And every lot has its own transit history — the same supplier, the same method, a different journey.
For a timeline question this matters more than it first appears. If the material differs between lots and nothing in the work records which lot was used, then anything observed across time may be reporting the material rather than the compound. It is the kind of confound that never shows up in the write-up, because the variable was never treated as a variable.
What removes it is per-lot analysis rather than a product-level specification sheet. A specification describes what the product is meant to be every time, which by construction cannot tell you whether this run came out like the last one. A certificate tied to a lot number can, and keeping that certificate with the lot record is what makes a comparison across time meaningful at all.
Starting from material you can account for
Timeline questions only become meaningful once the material is known, which puts documentation and handling ahead of scheduling in the order of things worth getting right.
We publish per-lot certificates of analysis with matching lot numbers, HPLC purity and mass-spectrometry identity confirmation, and ship under stated cold-chain conditions. You can see the retatrutide 20mg listing and its lot paperwork. Before anything else, correct reconstitution and storage technique protects what you have.
The lot documentation is the part that speaks directly to this page. Because each certificate is tied to a specific lot rather than to the product line, a lot change is visible rather than silent, and work carried out across more than one vial can account for it instead of absorbing it. That does not make a timeline predictable — nothing does, and this article has spent most of its length explaining why. It removes one of the reasons a timeline would be misleading. Supplied for laboratory research use only.
For research use only — not for human consumption. Nothing here is medical advice.